SEM Microstructure Phase Segmentation using Deep Learning
Overview
Accurate phase separation in Scanning Electron Microscope (SEM) imagery is essential for downstream quantitative metrology tasks such as morphology analysis, grain boundary characterization, and defect detection. Traditional segmentation approaches based on thresholding or manual annotation are often unreliable in the presence of imaging noise, low contrast regions, and overlapping material phases.
This project investigates whether deep learning-based semantic segmentation can reliably separate microstructural phases from grayscale SEM imagery under severe class imbalance conditions. A multi-class U-Net architecture was developed and evaluated using both a custom implementation and a transfer learning approach with a pretrained ResNet34 encoder.
The final model achieved:
- Test Mean IoU: ~0.88
- Test Mean Dice Score: ~0.91
indicating strong agreement between predicted and ground truth microstructural phase boundaries.
Dataset used in this study was obtained from the publicly available SEM microstructure dataset hosted on Zenodo.
Dataset Engineering & Label Integrity
Each SEM sample is provided with a corresponding pixel-wise segmentation mask where integer IDs represent different material phases.
Before model development, several dataset integrity checks were performed:
- Remapping raw label IDs to contiguous class indices
- Verification of valid mask values across the dataset
- Overlay visualization of masks with input SEM images
- Pixel-frequency analysis of each phase class
- Group-wise training/validation split to prevent leakage from augmented patches
Pixel fraction analysis revealed a highly imbalanced distribution across classes:
| Phase | Approx. Pixel Fraction |
|---|---|
| Class 0 | ~34% |
| Class 1 | <1% |
| Class 2 | ~41% |
| Class 3 | ~11% |
| Class 4 | ~13% |
This imbalance was expected to negatively affect model performance for minority phases and motivated the use of class-weighted loss functions during training.
Baseline Model: U-Net from Scratch
A minimal U-Net architecture was implemented from scratch using PyTorch to establish a performance baseline.
Training Setup:
- Input: Grayscale SEM image (1 channel)
- Output: 5-class segmentation mask
- Loss Function: Hybrid Cross Entropy + Dice Loss
- Class Weights: Computed from pixel frequency distribution
- Optimizer: AdamW
Initial training results indicated:
- Strong performance on dominant classes
- Near-zero IoU for minority phases
This behavior confirmed that standard convolutional feature learning was insufficient to capture rare microstructural patterns from limited training data.
Transfer Learning: U-Net with Pretrained ResNet34 Encoder
To improve generalization across underrepresented phases, transfer learning was applied using a pretrained ResNet34 encoder from the ImageNet dataset.
Adaptations included:
- Replicating grayscale SEM input to 3 channels
- Freezing encoder weights for initial training epochs
- Training decoder layers independently
- Gradual encoder unfreezing
- Reduced learning rate during fine-tuning
- ReduceLROnPlateau scheduler
- Early stopping based on validation IoU
Loss Function:
$\mathcal{L} = 0.6 \cdot \text{CrossEntropy} + 0.4 \cdot \text{DiceLoss}$
This training schedule resulted in improved convergence and significantly higher IoU values across previously underperforming classes.
Evaluation & Model Validation
Model performance was evaluated using several complementary metrics:
Pixel-wise Metrics
- Mean Intersection over Union (mIoU)
- Mean Dice Score
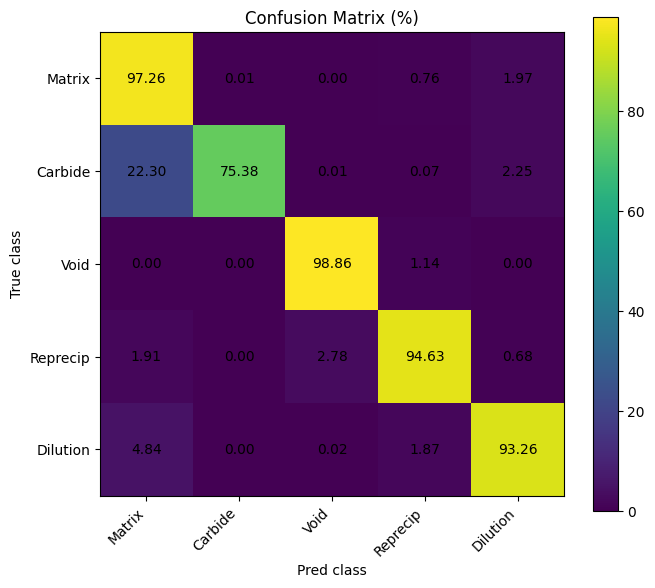
Confusion Matrix (Normalized %)
Provides insight into inter-class confusion at the pixel level.
Example observations:
- Class 1 occasionally misclassified as Class 0
- Class 3 shows boundary confusion with adjacent phases
- Majority classes exhibit >90% prediction accuracy
Boundary F1 Score
To assess morphological edge fidelity, boundary-aware F1 score was computed between predicted masks and ground truth segmentation.
This metric is particularly relevant in SEM-based metrology workflows where accurate phase boundary delineation directly influences morphology and dimensional measurements.
Class Frequency vs IoU Analysis
A correlation plot between class pixel frequency and IoU was generated to examine model sensitivity to data imbalance.
Results indicate:
- Improved IoU for minority classes after transfer learning
- Reduced performance gap between dominant and rare phases
- Balanced segmentation capability across phase types
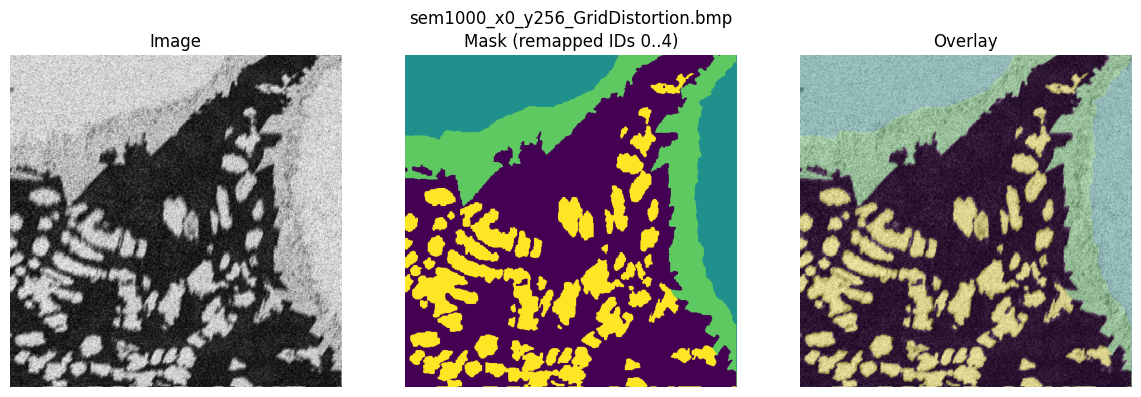
Qualitative Overlay Results
Model predictions were visually compared against ground truth masks using alpha-overlay visualization.
Displayed examples include:
- Ground Truth segmentation
- Model prediction
- Overlay comparison
These qualitative results demonstrate consistent alignment between predicted and actual phase boundaries.
Artifacts & Reproducibility
- Trained model weights (
.pt) available for download - Full implementation and training pipeline provided in GitHub repository
- Evaluation scripts for IoU, Dice, Confusion Matrix, and Boundary F1 included
Conclusion
This project developed and evaluated a deep learning pipeline for multi-class semantic segmentation of Scanning Electron Microscopy (SEM) images, targeting five microstructural phases: Matrix, Carbide, Void, Reprecipitate, and Dilution zone. A UNet architecture with a pretrained ResNet-34 encoder was trained on an augmented dataset and evaluated on a held-out test set of 54 images.
Performance Summary
The model demonstrated strong segmentation performance across the test set. Evaluated at the image level to avoid batch-size bias, the model achieved the following aggregate results:
| Metric | Mean | Std | Min | Max |
|---|---|---|---|---|
| mIoU | 0.872 | 0.088 | 0.723 | 0.958 |
| mDice | 0.912 | 0.079 | 0.759 | 0.978 |
| mBF1 | 0.728 | 0.027 | 0.678 | 0.773 |
The mean Intersection over Union (mIoU) of 0.872 and mean Dice score of 0.912 confirm that the model produces highly accurate pixel-wise segmentation masks across the majority of test images. The mean Boundary F1 (mBF1) of 0.728 reflects moderate precision at class boundaries, which is expected given the fine structural detail and low contrast between adjacent phases in SEM imagery.
Per-Class Analysis
The pixel-wise confusion matrix revealed notable differences in per-class difficulty:
| Class | Correctly Classified (%) | Primary Confusion |
|---|---|---|
| Matrix | 97.3 | Dilution (1.97%) |
| Carbide | 75.4 | Matrix (22.3%) |
| Void | 98.9 | Reprecipitate (1.14%) |
| Reprecipitate | 94.6 | Void (2.78%) |
| Dilution | 93.3 | Matrix (4.84%) |
The Void and Matrix classes achieved near-perfect classification rates, likely due to their visually distinct appearance in SEM images. The Carbide class was the most challenging, with 22.3% of Carbide pixels misclassified as Matrix. This is consistent with the visual similarity between fine carbide precipitates and the surrounding matrix at certain imaging conditions, and is reflected in the lowest per-class IoU observed during evaluation.
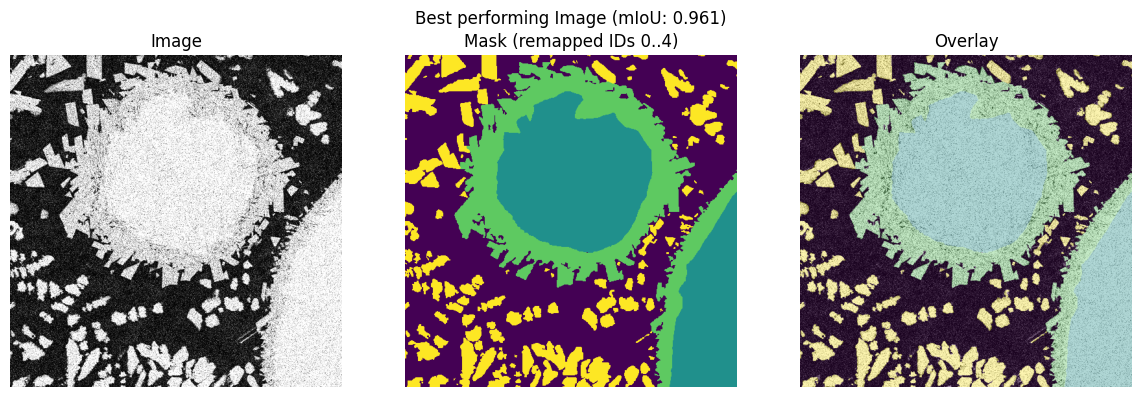
Qualitative Evaluation on Held-Out Test Data
The best performing image group (mIoU = 0.961) consisted of contrast-
and brightness-augmented variants of the same base image
(sem700_x256_y288), suggesting the model handles
photometric variation well.
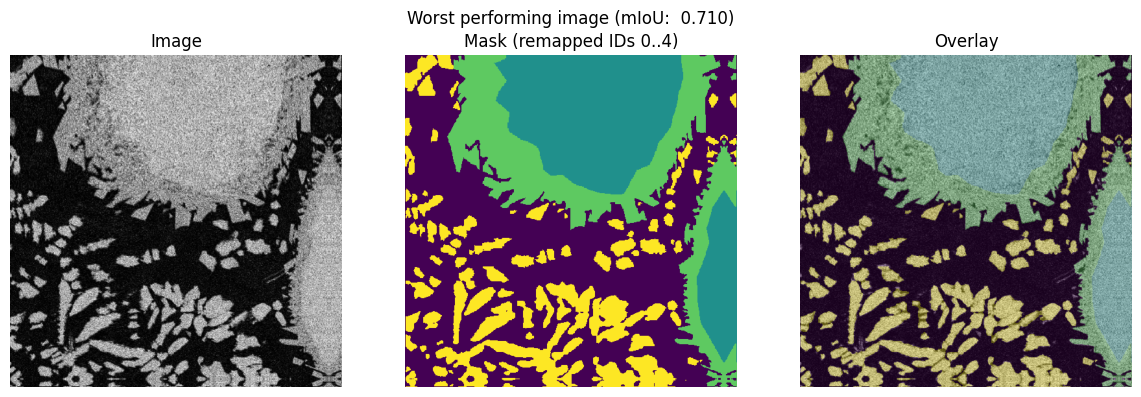
The lowest scoring images
(sem800_x0_y256 with VerticalFlip and GridDistortion
augmentations) achieved mIoU = 0.710, indicating that geometric
distortions — particularly grid distortion — remain a challenge for
precise boundary delineation, consistent with the relatively lower mBF1
scores observed overall.
Limitations and Future Work
Despite strong overall performance, several limitations remain. The Carbide class presents a persistent source of confusion with the Matrix class, which could be addressed through targeted strategies such as increased augmentation for underrepresented classes, harder negative mining, or incorporating higher resolution inputs to preserve fine-grained carbide morphology. The mBF1 scores, while acceptable, suggest that boundary precision could be improved through boundary-aware loss functions or post-processing refinement such as conditional random fields (CRF).
Future work could explore applying the pretrained pipeline to new SEM imaging conditions, extending the class set to additional microstructural phases, and deploying the model as a real-time inference service — for which the FastAPI and Docker integration planned as the next stage of this project provides a natural foundation.
Acknowledgement
SEM microstructure dataset used in this work was obtained from the publicly available Zenodo repository.
Safdar, M. (2025). Scanning Electron Microscopy (SEM) Dataset of Additively Manufactured Ni-WC Metal Matrix Composites for Semantic Segmentation (Version 1) [Data set]. Zenodo. https://doi.org/10.5281/zenodo.17315241
All credit for dataset creation and annotation belongs to the original contributors.