Automated Image Quality Assessment (IQA) for SEM Metrology
Overview
A Python-based toolkit developed to ensure the stability and consistency of image quality from Scanning Electron Microscopes (SEM) used in high-volume semiconductor manufacturing. By automating the measurement of critical image degradation factors (focus, stigmation, noise), the project shifts quality control from subjective visual checks to objective, quantitative metrics. This directly supports accurate Critical Dimension (CD) and defect metrology, where image consistency is paramount.
Tech Stack: Python, NumPy, OpenCV, scikit-image, Matplotlib, SciPy
Environment: Jupyter Notebook / Colab for interactive analysis
Links & Artifacts
Key Features & Technical Achievements
Automated Image Quality Assessment (IQA): Implemented a suite of both Full-Reference (e.g., Structural Similarity Index, SSIM; Peak Signal-to-Noise Ratio, PSNR) and No-Reference (e.g., Laplacian Variance, BRISQUE) metrics. This provides a comprehensive, objective score for image quality to quantify the tool health.
Domain-Specific Metric Implementation: Adapted the Normalized Variance Focus Score (Normvar), a key technique from academic literature, specifically for Gold-on-Carbon (GoC) reference images, aligning the tool with industry-standard qualification methods.
Tool-to-Tool Matching: Developed histogram comparison and Frequency-domain (FFT) analysis to statistically verify the consistency of operating parameters across different SEM machines, a critical requirement for high-reliability fabs.
Simulation of Degradations: Created functions to synthetically generate realistic SEM image flaws (Gaussian Blur for defocus, Anisotropic Blur for stigmation, and Poisson/Gaussian noise), providing a robust validation suite for the assessment algorithms.
Impact
Improved Manufacturing Yield: Reduced reliance on manual, subjective quality checks, leading to faster tool qualification and minimized downtime from unstable SEMs.
Enhanced Data Reliability: Provided quantitative proof of image quality, ensuring that all subsequent metrology and machine learning models are trained and run on reliable, consistent input data.
Stable image quality is table-stakes for reliable CD/overlay metrology. Focus drift, stigmation, detector noise, and operating-point changes silently degrade measurements. This project provides a repeatable, quantitative way to:
Detect IQ drift early (before it hits SPC).
Compare tool-to-tool outputs after maintenance or recipe transfers.
Create explainable visuals (SSIM maps, FFT energy ratios, histogram overlays) for quick, defensible decisions.
Methods
Full-reference
- SSIM compares luminance/contrast/structure between reference and test images. Good for localizing degradation (SSIM maps).
- PSNR summarises signal fidelity (dB). Simple but useful for quick screening.
No-reference
- Normalized variance: cheap focus/sharpness proxy.
- FFT high-frequency ratio: proportion of energy above a radial cutoff; drops as images lose fine detail (defocus, stigmation).
- CNR (ROI-based): ( = ) over stable ROIs; separates contrast shifts vs. noise growth.
Tool-to-tool matching
- Histogram comparison (e.g., Bhattacharyya/Chi-square similarity depending on your implementation) across matched ROIs or full frames. Pairs nicely with CNR to disambiguate contrast vs. noise changes.
Featured IQA results:
Gold on Carbon(GoC) image focus assesment
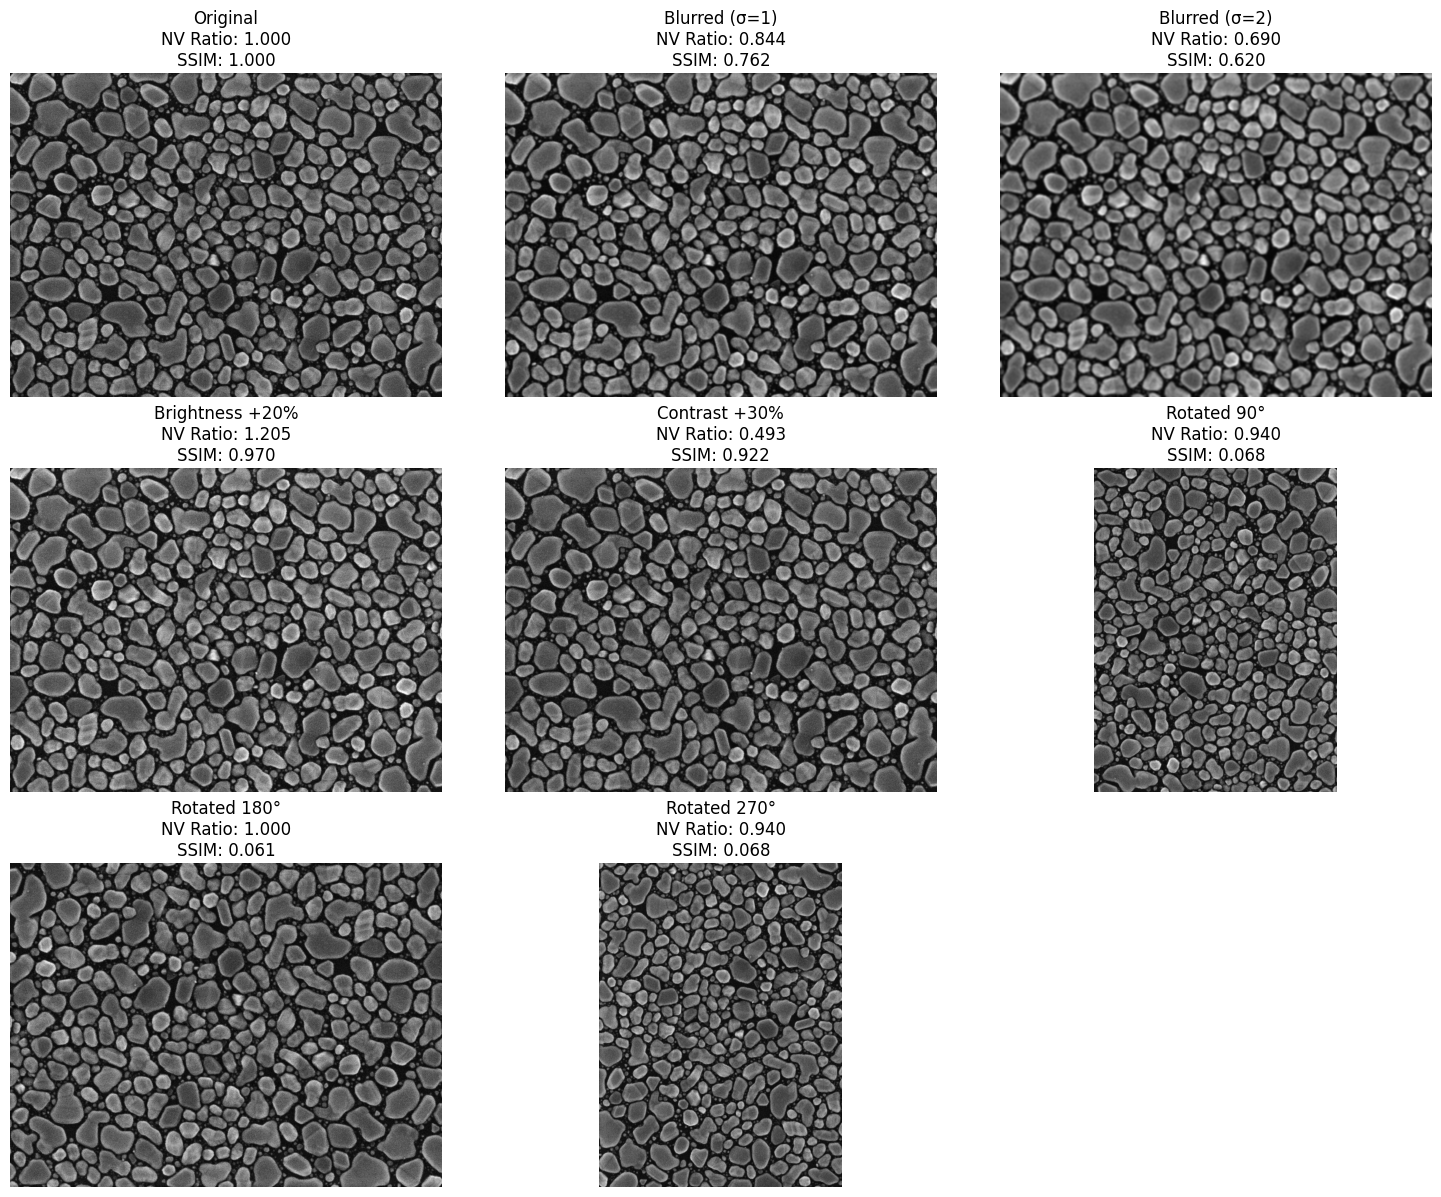
Metric Comparison Across Image Variations
| Image Variation | NV Ratio | PSNR | SSIM |
|---|---|---|---|
| Original | 1.000 | ∞ | 1.000 |
| Blurred (σ = 1) | 0.844 | 27.361 | 0.762 |
| Blurred (σ = 2) | 0.690 | 24.378 | 0.620 |
| Brightness + 20% | 1.205 | 23.288 | 0.970 |
| Contrast + 30% | 0.493 | 25.854 | 0.922 |
| Rotated 90° | 0.940 | 12.526 | 0.068 |
| Rotated 180° | 1.000 | 12.361 | 0.061 |
| Rotated 270° | 0.940 | 12.525 | 0.068 |
Findings
- Normalized Variance (NV) ratio remains relatively
stable across brightness changes but decreases consistently with
blur.
- PSNR and SSIM are highly sensitive
to brightness/contrast changes, which are common in SEM imaging but
don’t necessarily indicate focus quality.
- NV is rotation-invariant, providing consistent
scores for rotated images.
- For Gold-on-Carbon SEM images, NV provides a more consistent focus measure that aligns with human perception of sharpness.
Stigmation
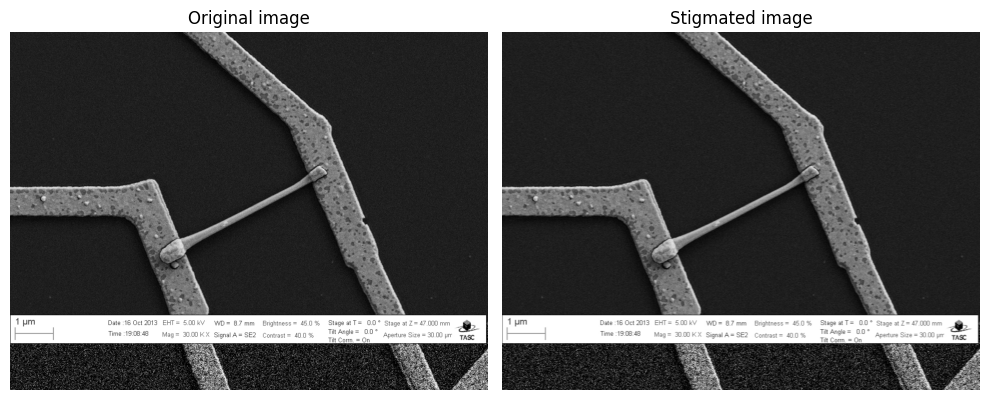
IMAGE QUALITY ASSESSMENT REPORT
Distortion Type: Stigmation
1. Main Metrics Comparison
| Metric | Current Value | Ideal Value | Interpretation |
|---|---|---|---|
| SSIM | 0.772 | 1.0000 | Higher is better |
| PSNR | 23.82 dB | ∞ dB | Higher is better |
| NormVar Focus Ratio | 0.938 | 1.000 | Closer to 1 is better |
| Laplacian Sharpness Ratio | 0.244 | 1.000 | Closer to 1 is better |
2. Detailed Scores Breakdown
| Metric | Original | Stigmation |
|---|---|---|
| Normalized Variance Focus | 75.69 | 71.02 |
| Laplacian Sharpness | 8174.52 | 1991.11 |
| BRISQUE Score | 44.38 | 14.576 |
3. Key Findings
- BRISQUE is not a suitable metric.
- Norm Var : Focus quality has degraded significantly.
- Laplacian Sharpness: Image sharpness has been reduced.
FFT Sharpness
- Comparing sharpness using FFT( Fast Fourier Transform)
- Using simulated SEM like stigmated image for FFT sharness
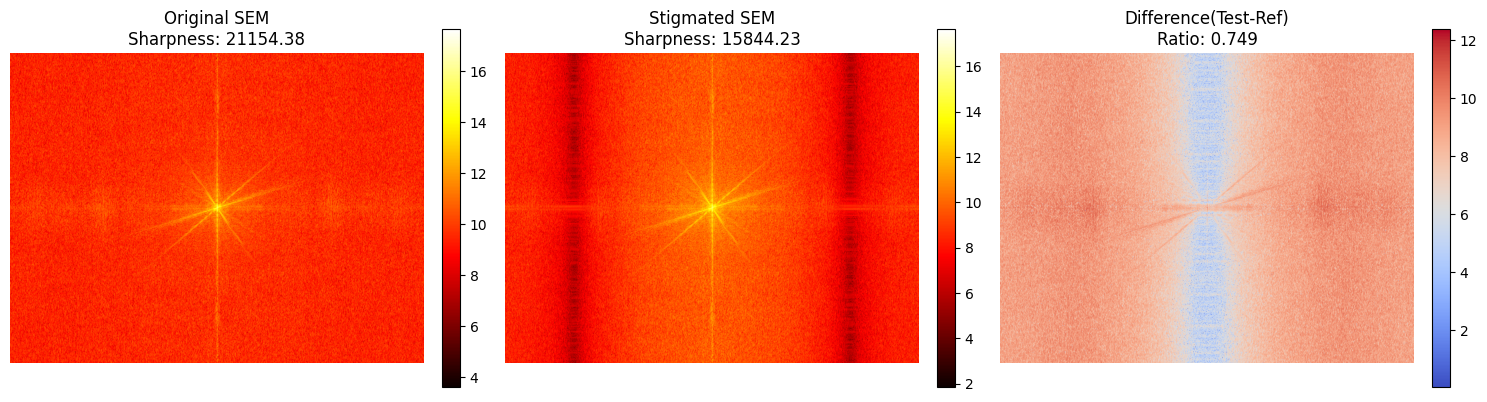
FFT Spectrum Analysis Report
| Parameter | Value |
|---|---|
| Reference Sharpness | 21154.38 |
| Test Sharpness | 15844.23 |
| Sharpness Ratio | 0.749 |
| Sharpness Difference (Test − Ref) | -5310.15 |
| Assessment | ~ Moderate focus loss |
Image Histogram
Histogram compare for tool-to-tool matching
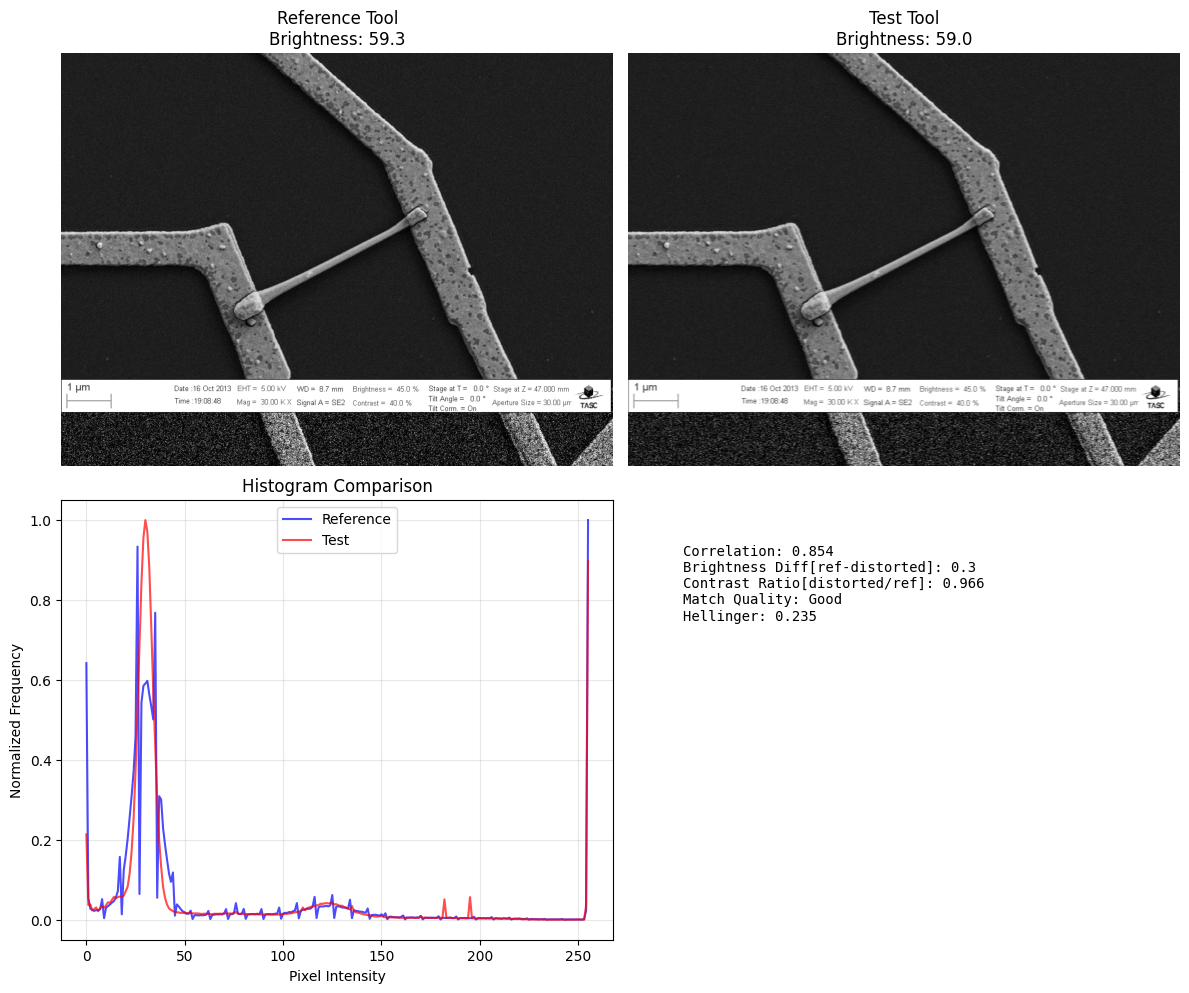
  ========================================
  HISTOGRAM REPORT
  ========================================
  correlation_score : 0.8544051386777778
  chi_square : 13.265943275829432
  hellinger_distance : 0.2348046244606338
  intersection : 10.474023181097436
  ref_brightness : 59.33144887288411
  ref_contrast : 67.01170715490987
  dis_brightness : 59.025578816731766
  dis_contrast : 64.74474942295193
  brightness_difference : 0.30587005615234375
  contrast_ratio : 0.9661707210843404
  dynamic_range_ref : 255
  dynamic_range_dis : 255
  match_quality : Good
  ========================================
Conclusion
Effective for common failure modes.
Focus/blur & stigmation: Laplacian and FFT-ratio trend down as blur increases; SSIM agrees and localizes loss on edges.
Noise (shot/read): SSIM/PSNR decline with higher noise; FFT-ratio can rise (noise injects high-frequency energy) while Laplacian stays relatively stable, helping distinguish noisy-sharp from clean-blurred.
Operating-point drift: Histogram means/widths and CNR reveal gain/offset and contrast changes that don’t always show up in sharpness scores.
Actionable in production. The metrics are quick to compute, easy to threshold, and simple to visualize on dashboards. They support spot checks, lot start/end health checks, and tool matching after maintenance or recipe edits.
Auditable and transferable. All steps are documented, with deterministic preprocessing (grayscale normalization, fixed ROIs, seeds). Because the methods are standard and lightweight, they are easy to adopt across teams and tools.
Practical takeaways
Use SSIM + Laplacian + FFT-ratio together: the trio separates blur from noise and flags structural loss where it matters (edges and features).
Track histogram stats for day-to-day tool consistency and after any detector/beam parameter changes.
When a flag triggers, inspect SSIM maps and FFT views to locate the problem (focus/stigmation/operating point).